Infographics
The book at every altitude, as pictures: what exists, what is proposed, what is drawn, and the review that decides which go into the next candidate. Drawn from data by code, checked against the text by the build, and nothing in the book until Dinis says so.
81proposed10drawn41 of 41chapters covered48priority 10accepted
81 proposals
By altitude, part and chapter, each with what it shows, why, what is on it, its sources and the newsroom figures behind it. Accept, change, decline or later, and export.
What exists31 images in 2018, 156 in the newsroom
The 2018 book's pictures, looked at one by one, with what to do with each; the newsroom's figures in the articles the book draws on; the storyboard panels that already are infographics.
How they are madeData, code, a palette, a gate
The four altitudes, the methods, the drawing, the palette, what the build refuses, the states, and how to review.
Drawn, not reviewed
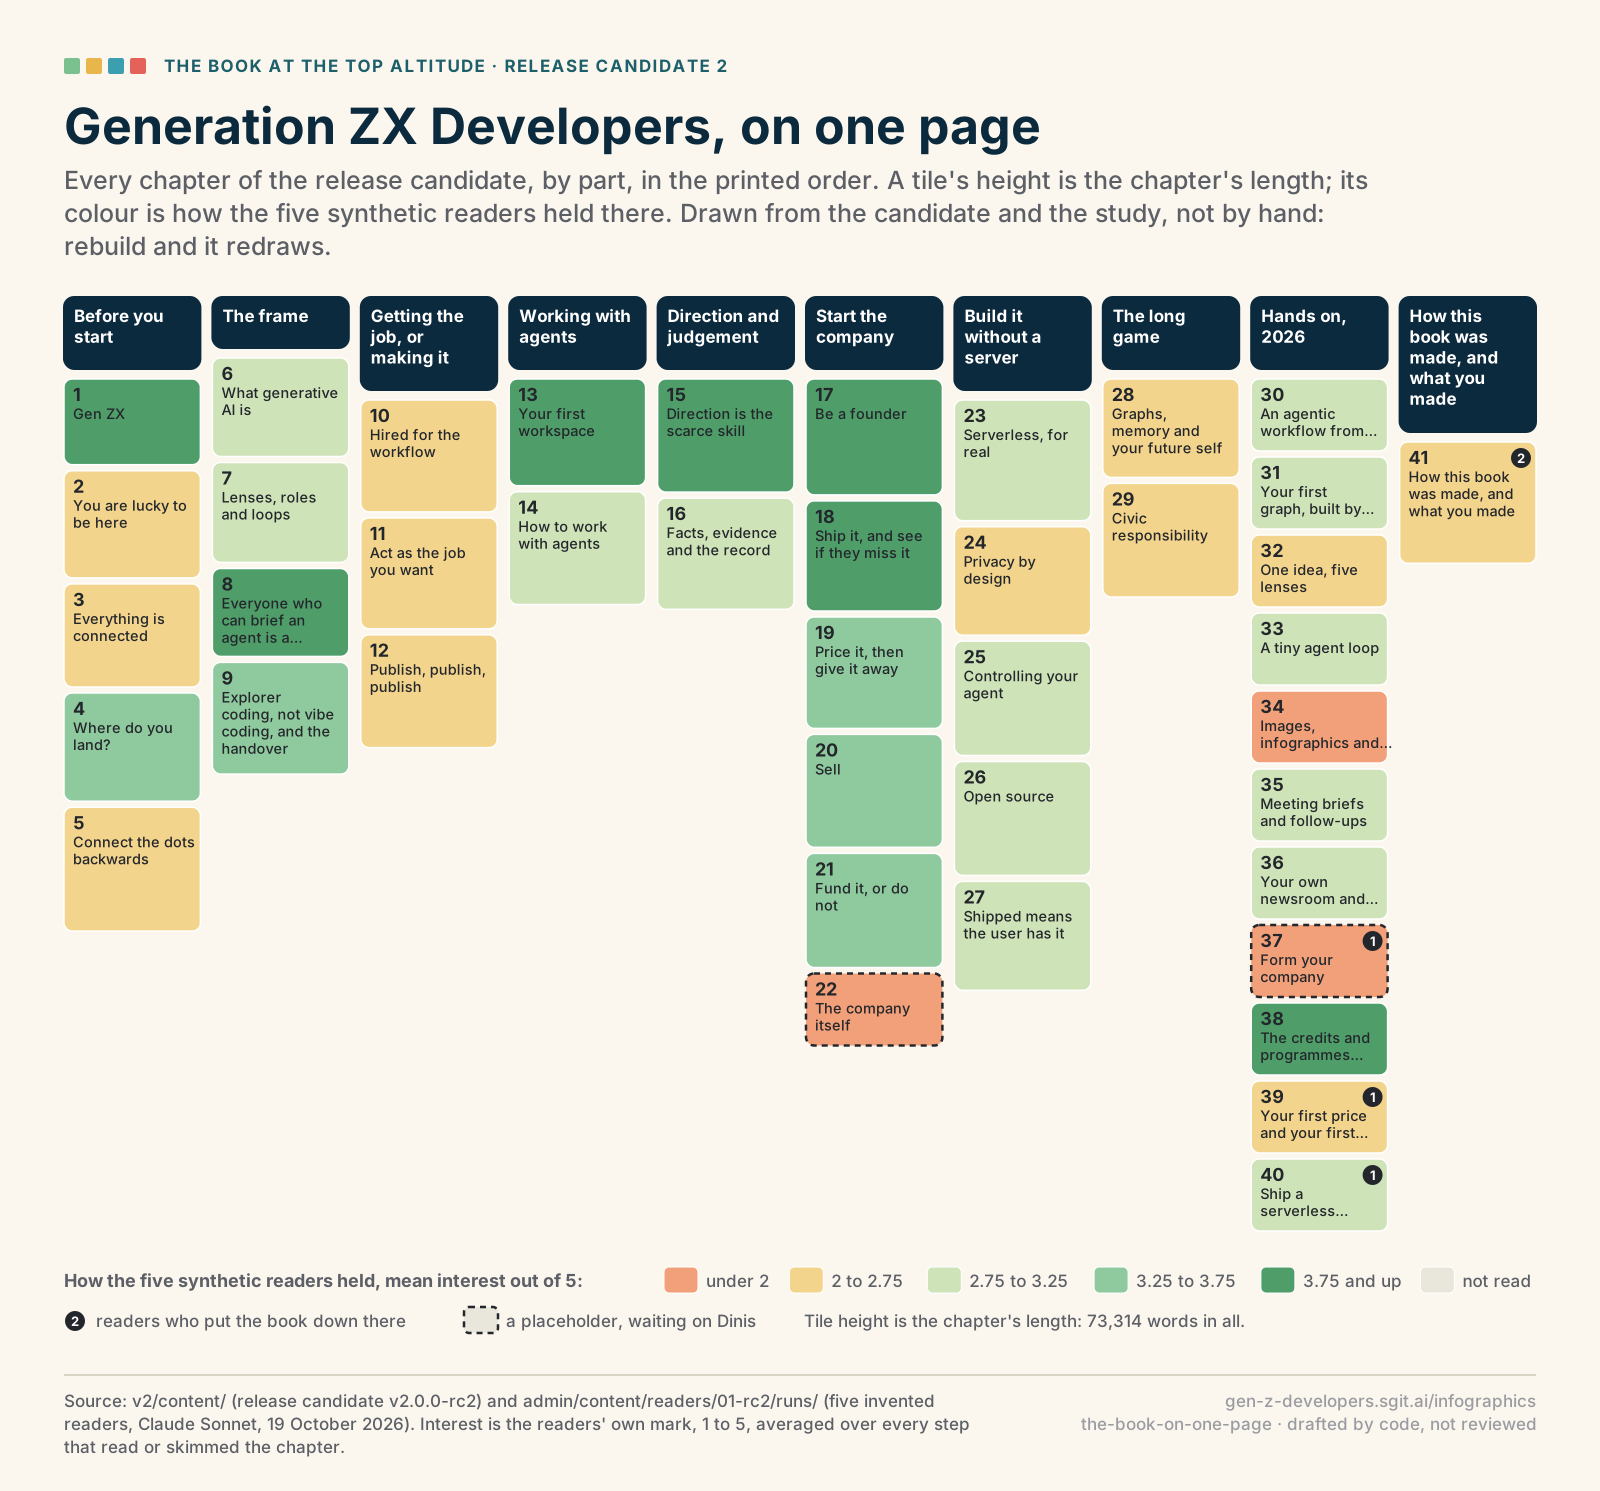
10 prototypes, chosen where the synthetic readers said the book is slowest or most useful, and where the 2018 book has a hole: the whole book on one page; the three figures the 2018 STEM chapter never generated; the chapter the rest of the book is navigated by; the four tests and sums a founder would pin on the wall; the two pictures that explain part 7 to a reader who does not code; and the making-of in one loop.
Generation ZX Developers, on one pageThe book at the top altitude · release candidate 2
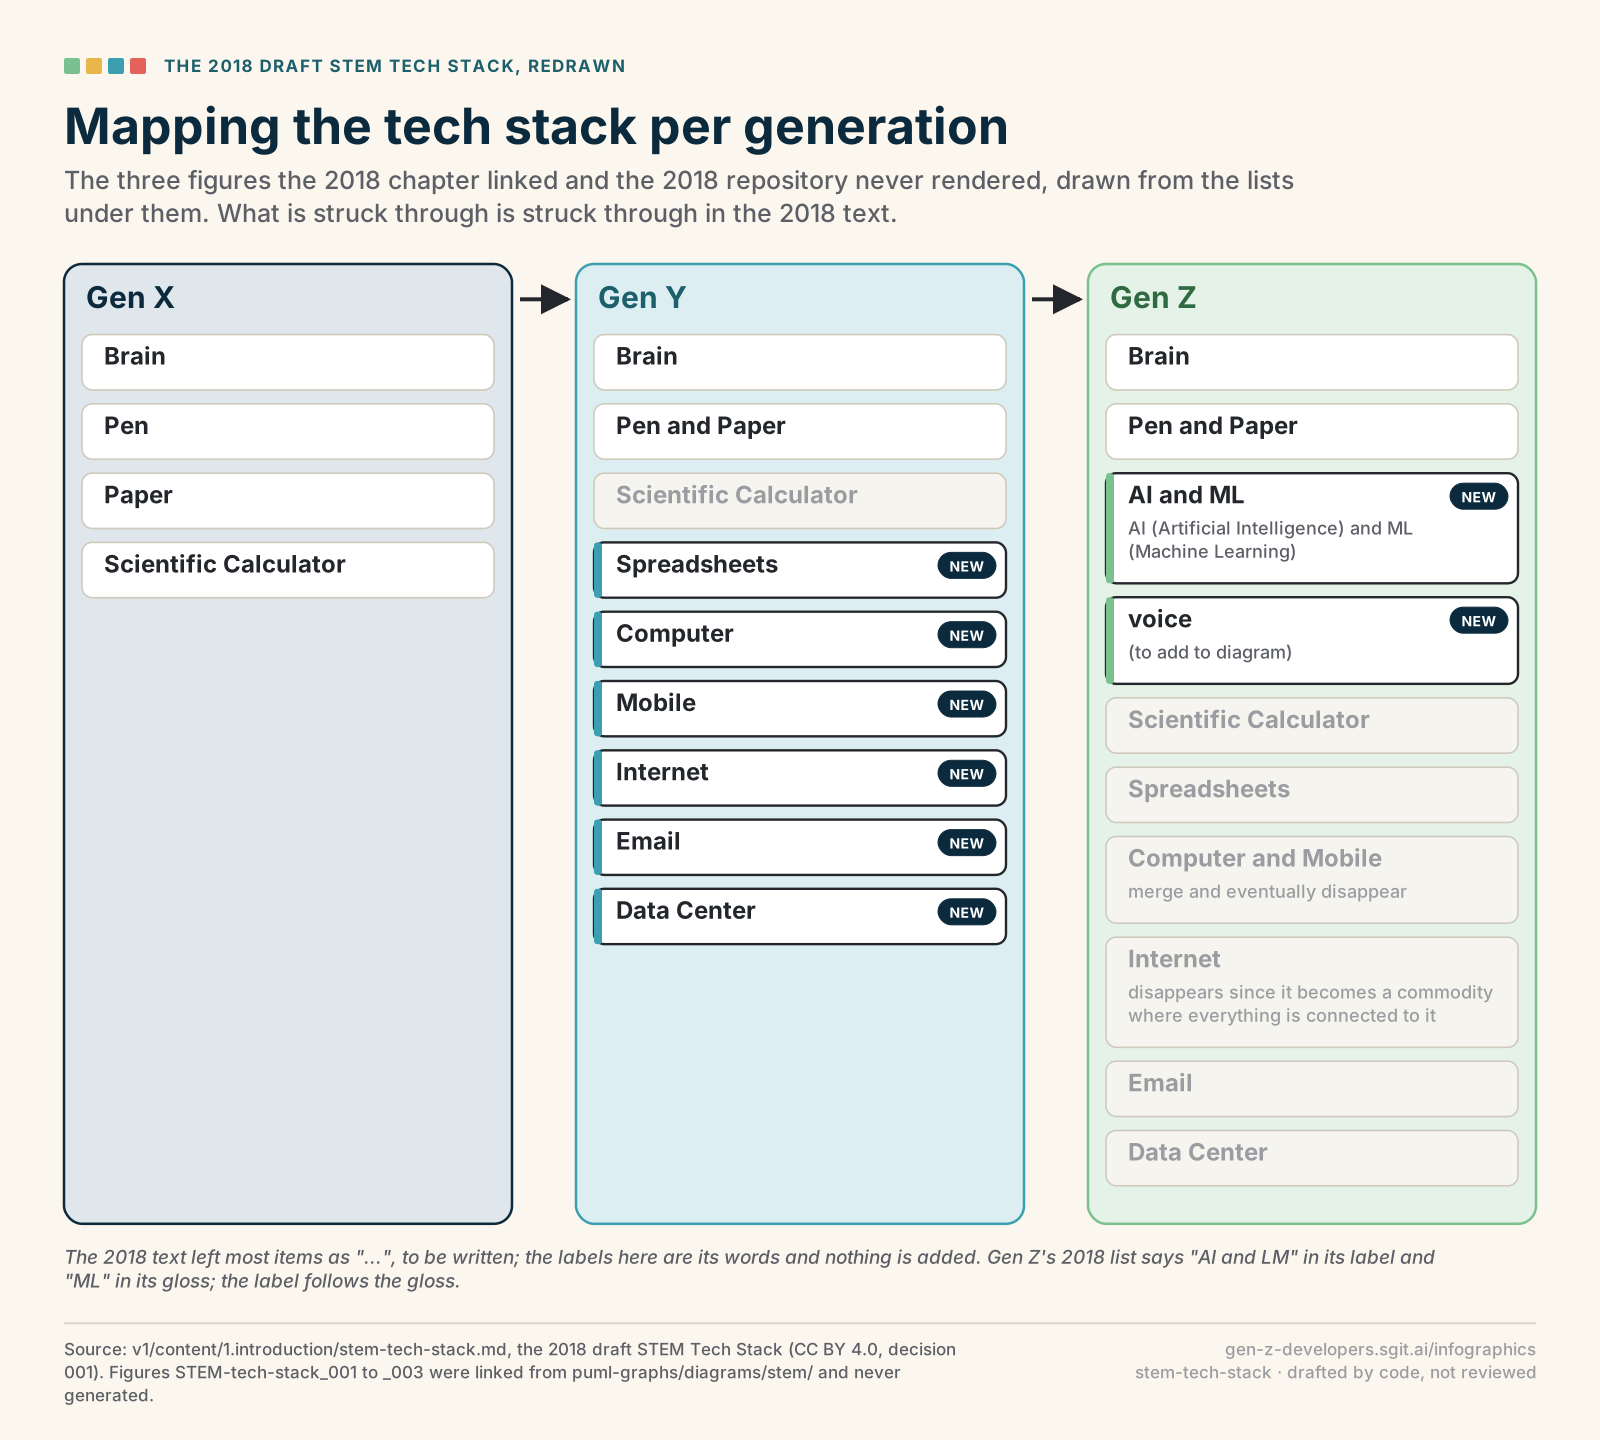 Mapping the tech stack per generation
The 2018 draft STEM Tech Stack, redrawn
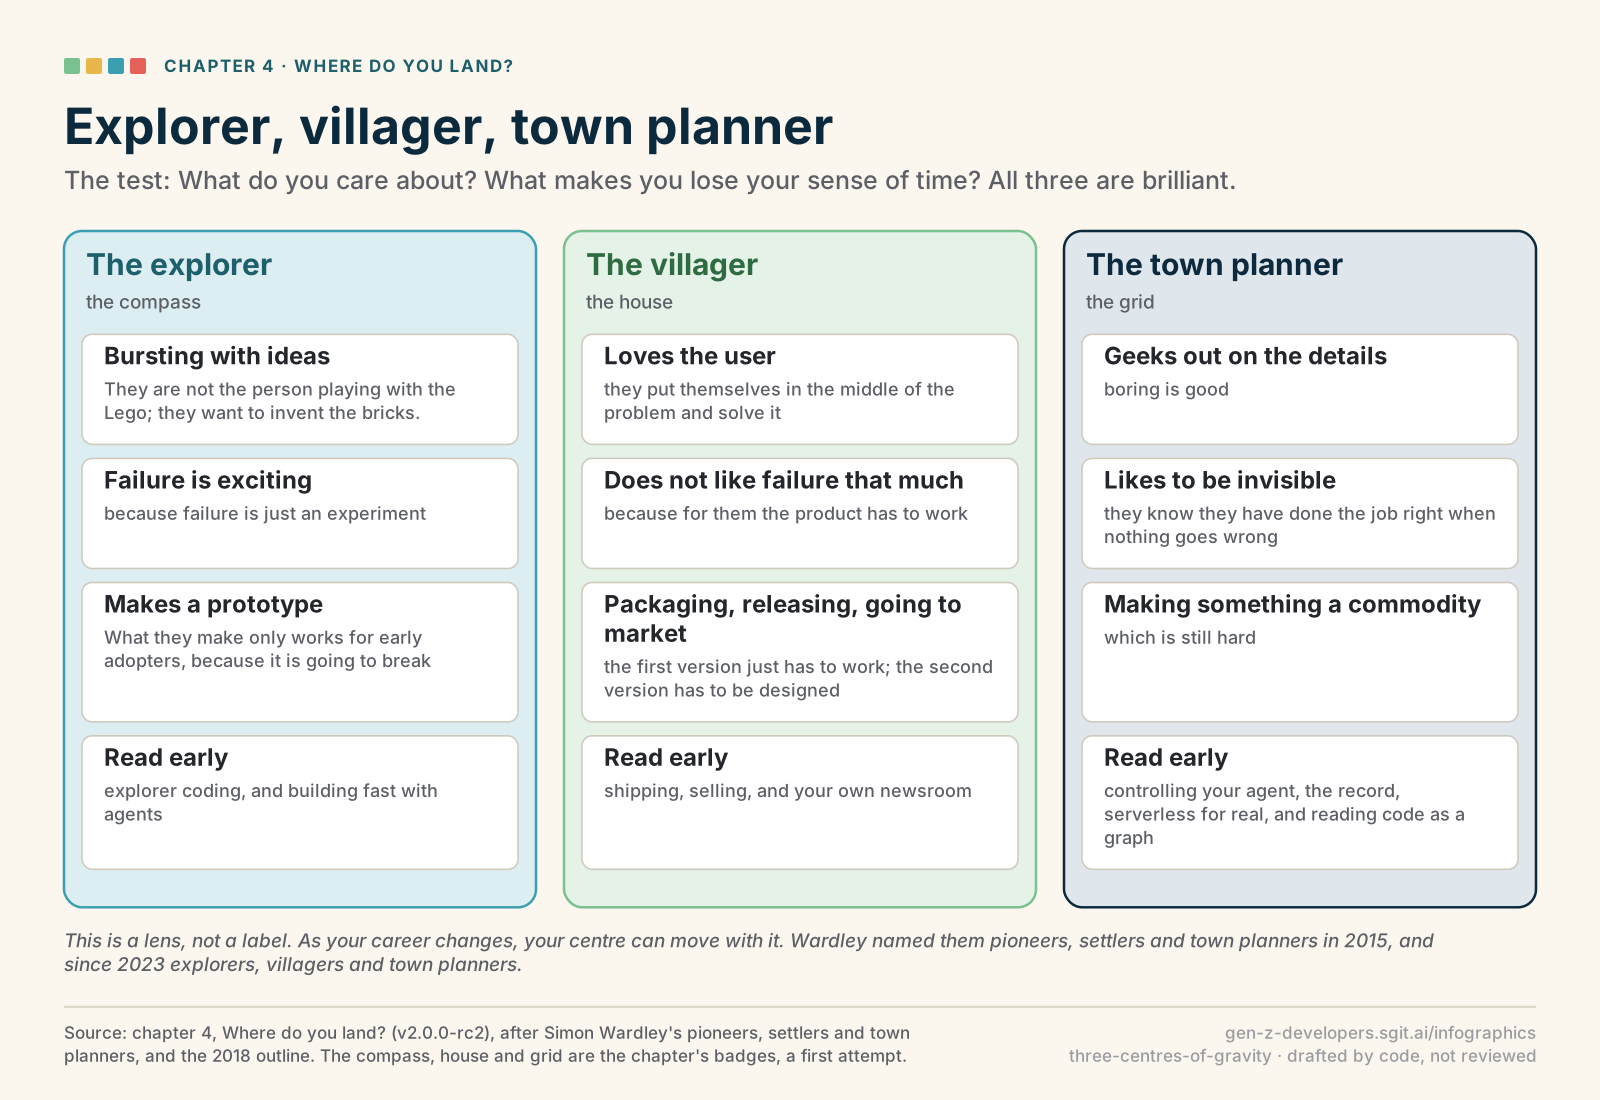 Explorer, villager, town planner
Chapter 4 · Where do you land?
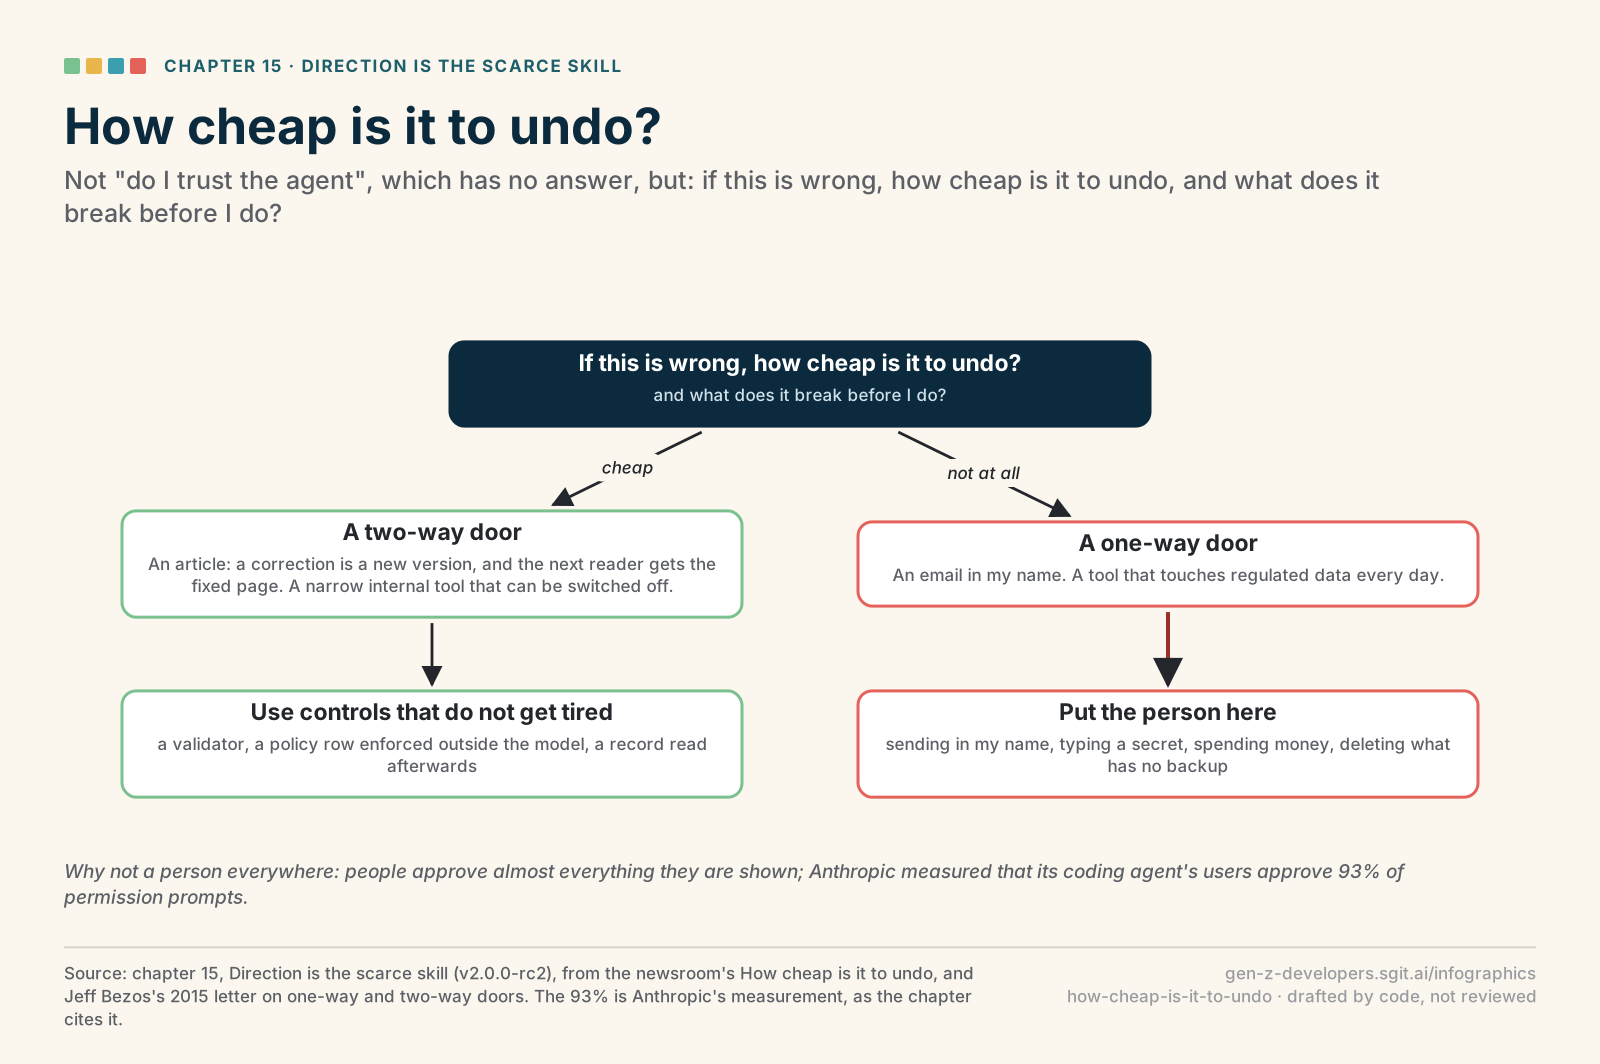 How cheap is it to undo?
Chapter 15 · Direction is the scarce skill
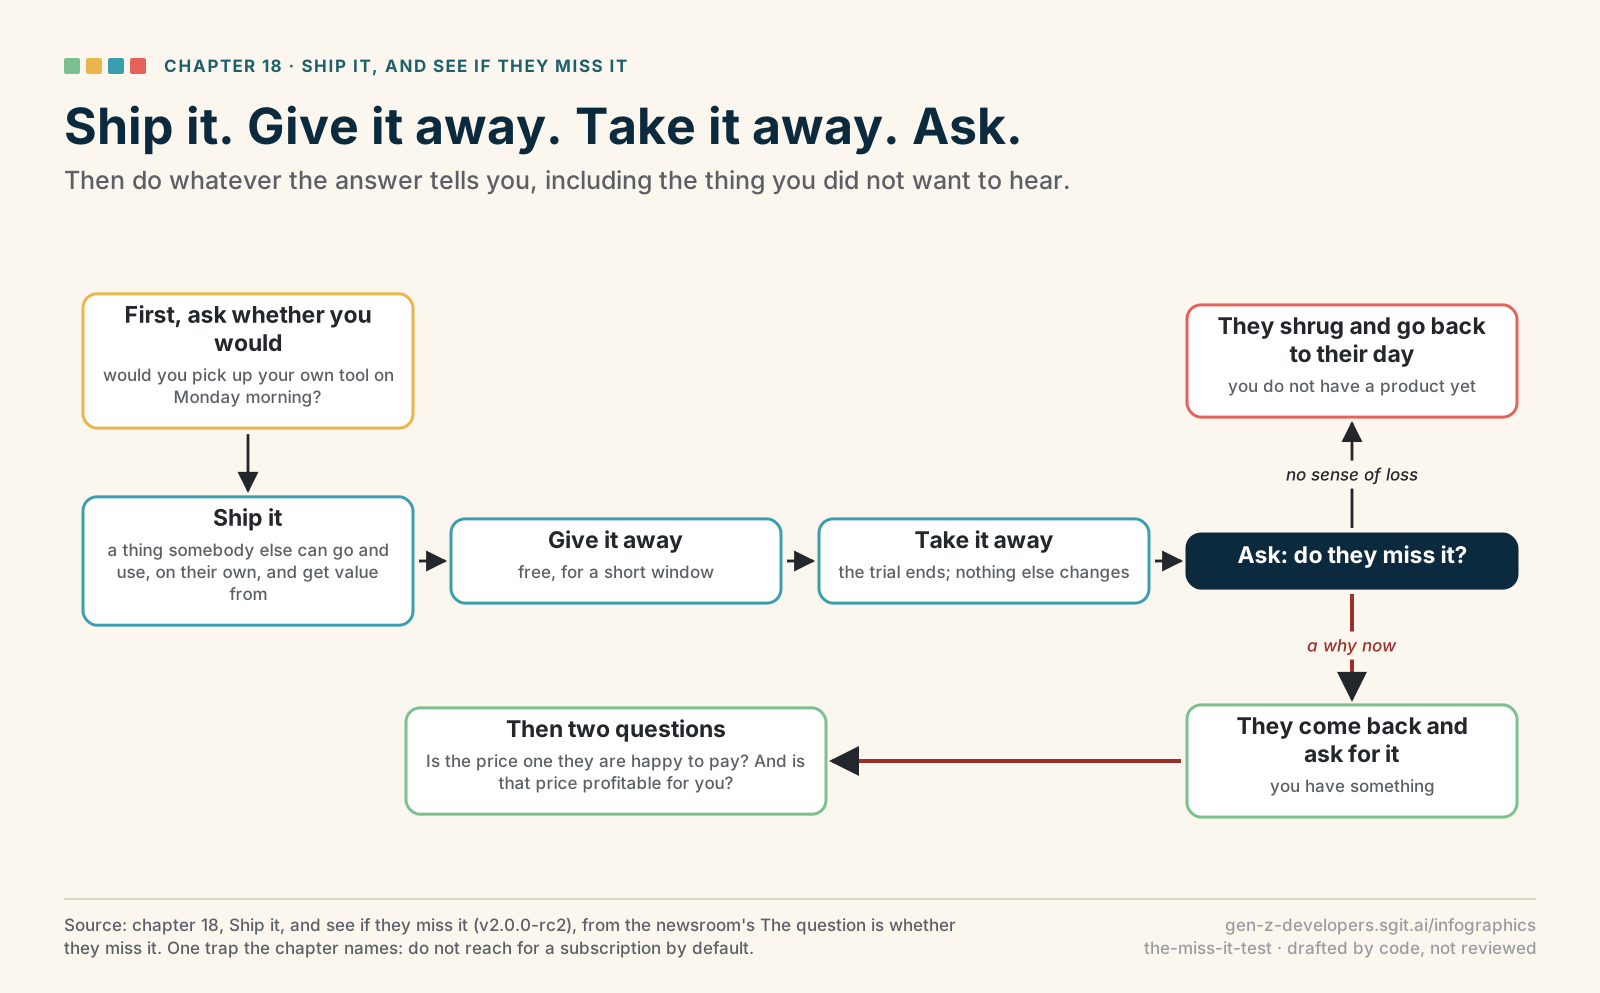 Ship it. Give it away. Take it away. Ask.
Chapter 18 · Ship it, and see if they miss it
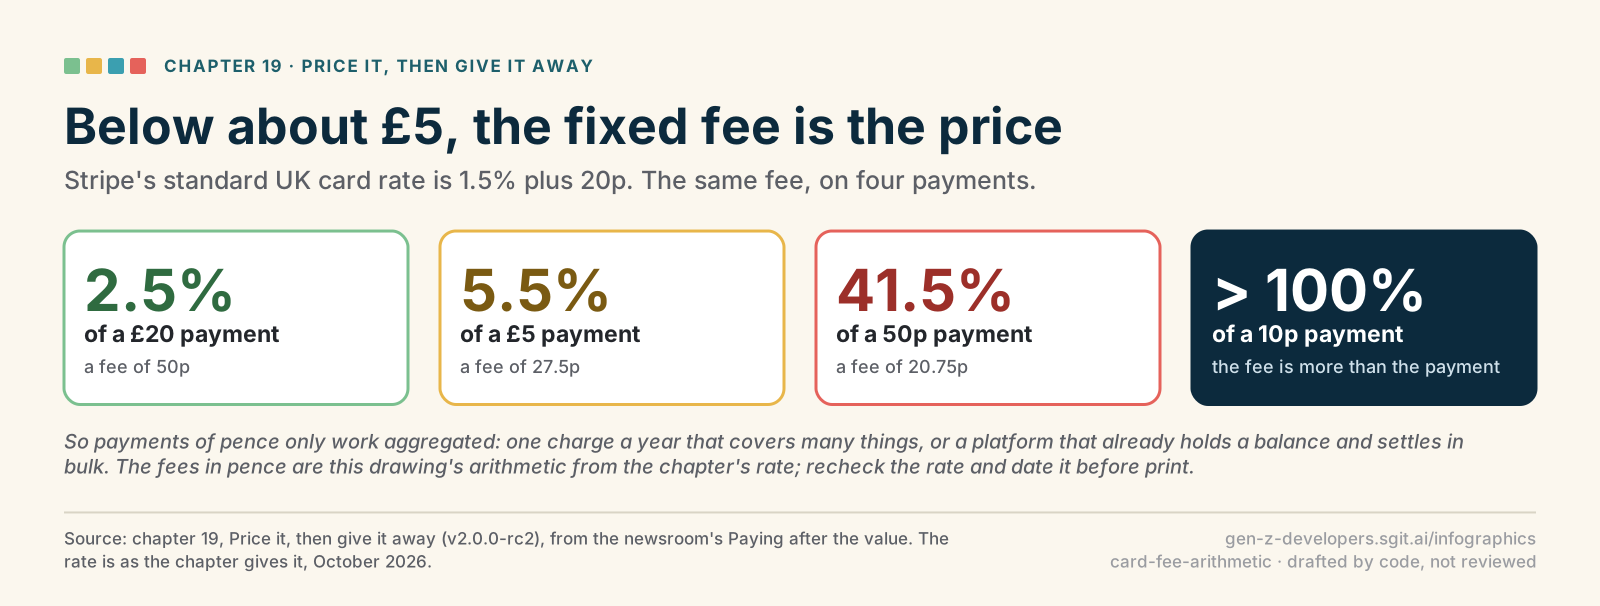 Below about £5, the fixed fee is the price
Chapter 19 · Price it, then give it away
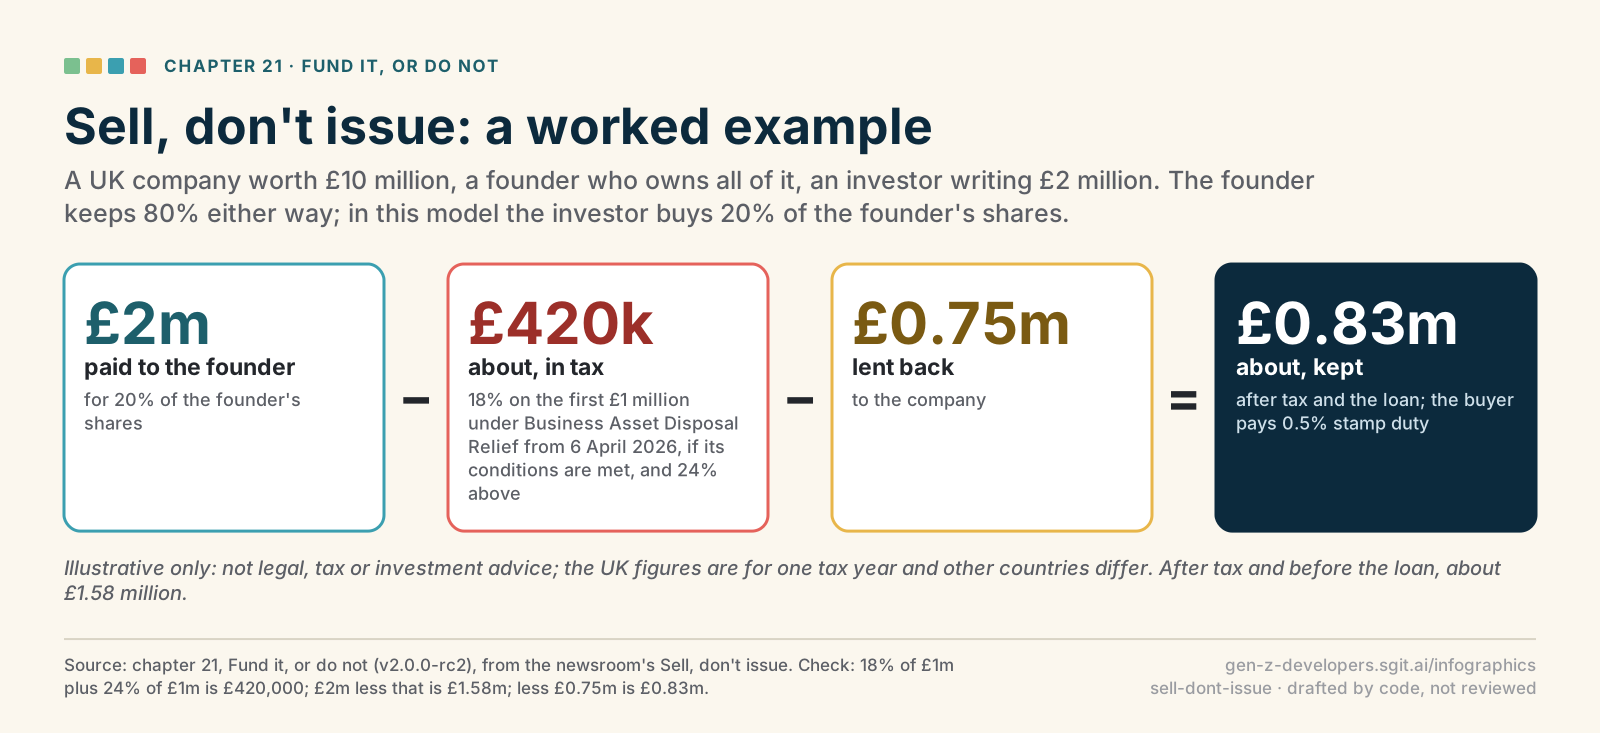 Sell, don't issue: a worked example
Chapter 21 · Fund it, or do not
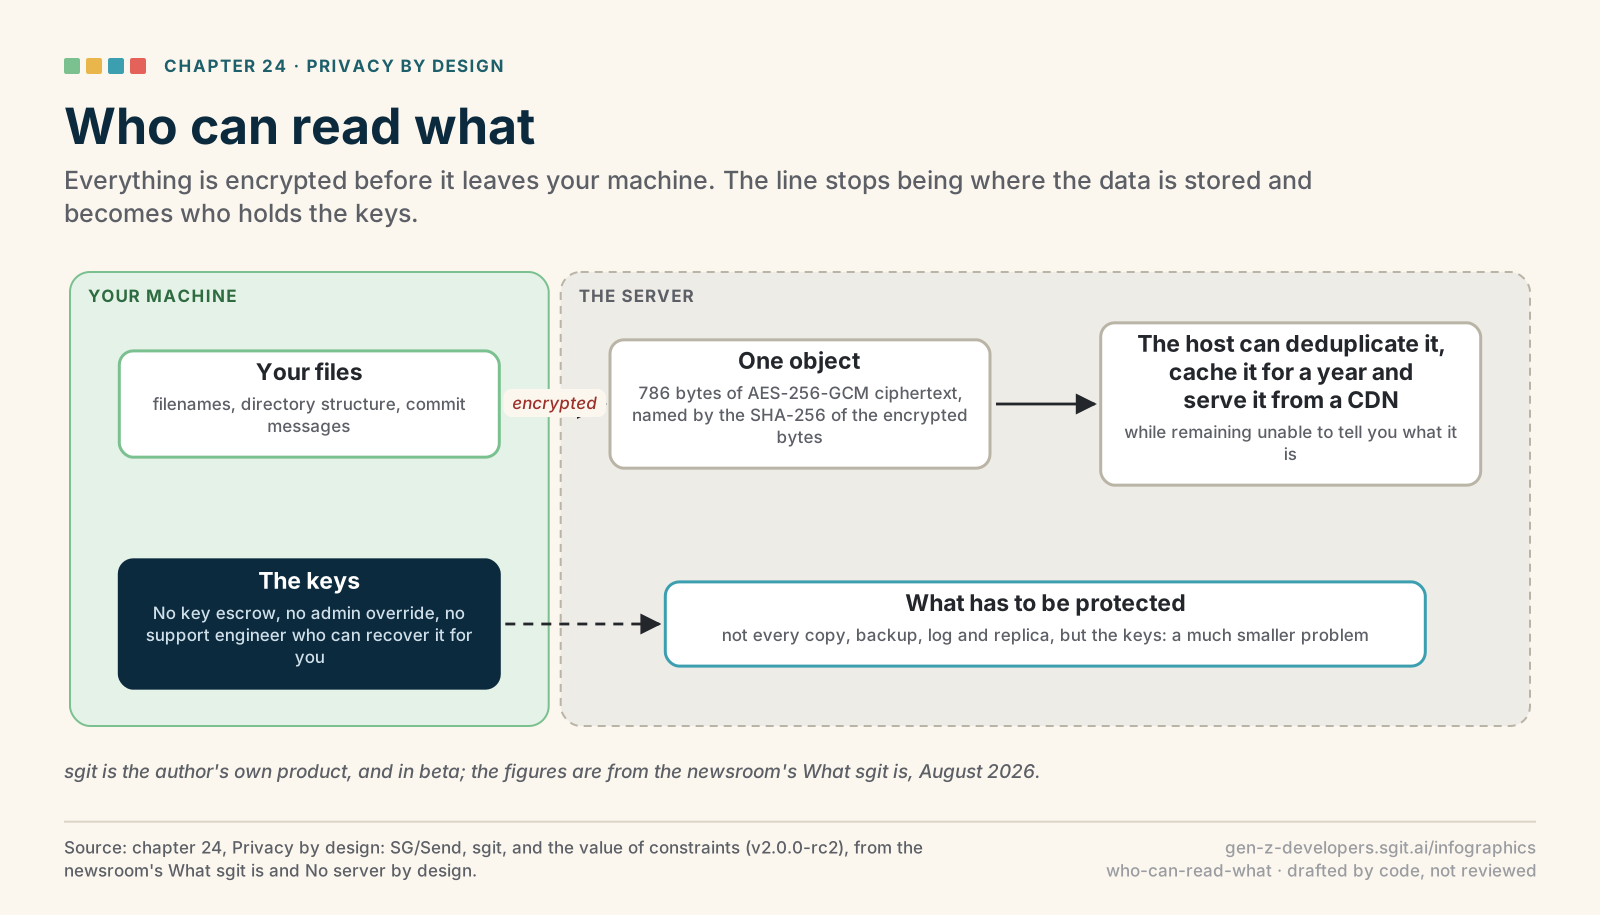 Who can read what
Chapter 24 · Privacy by design
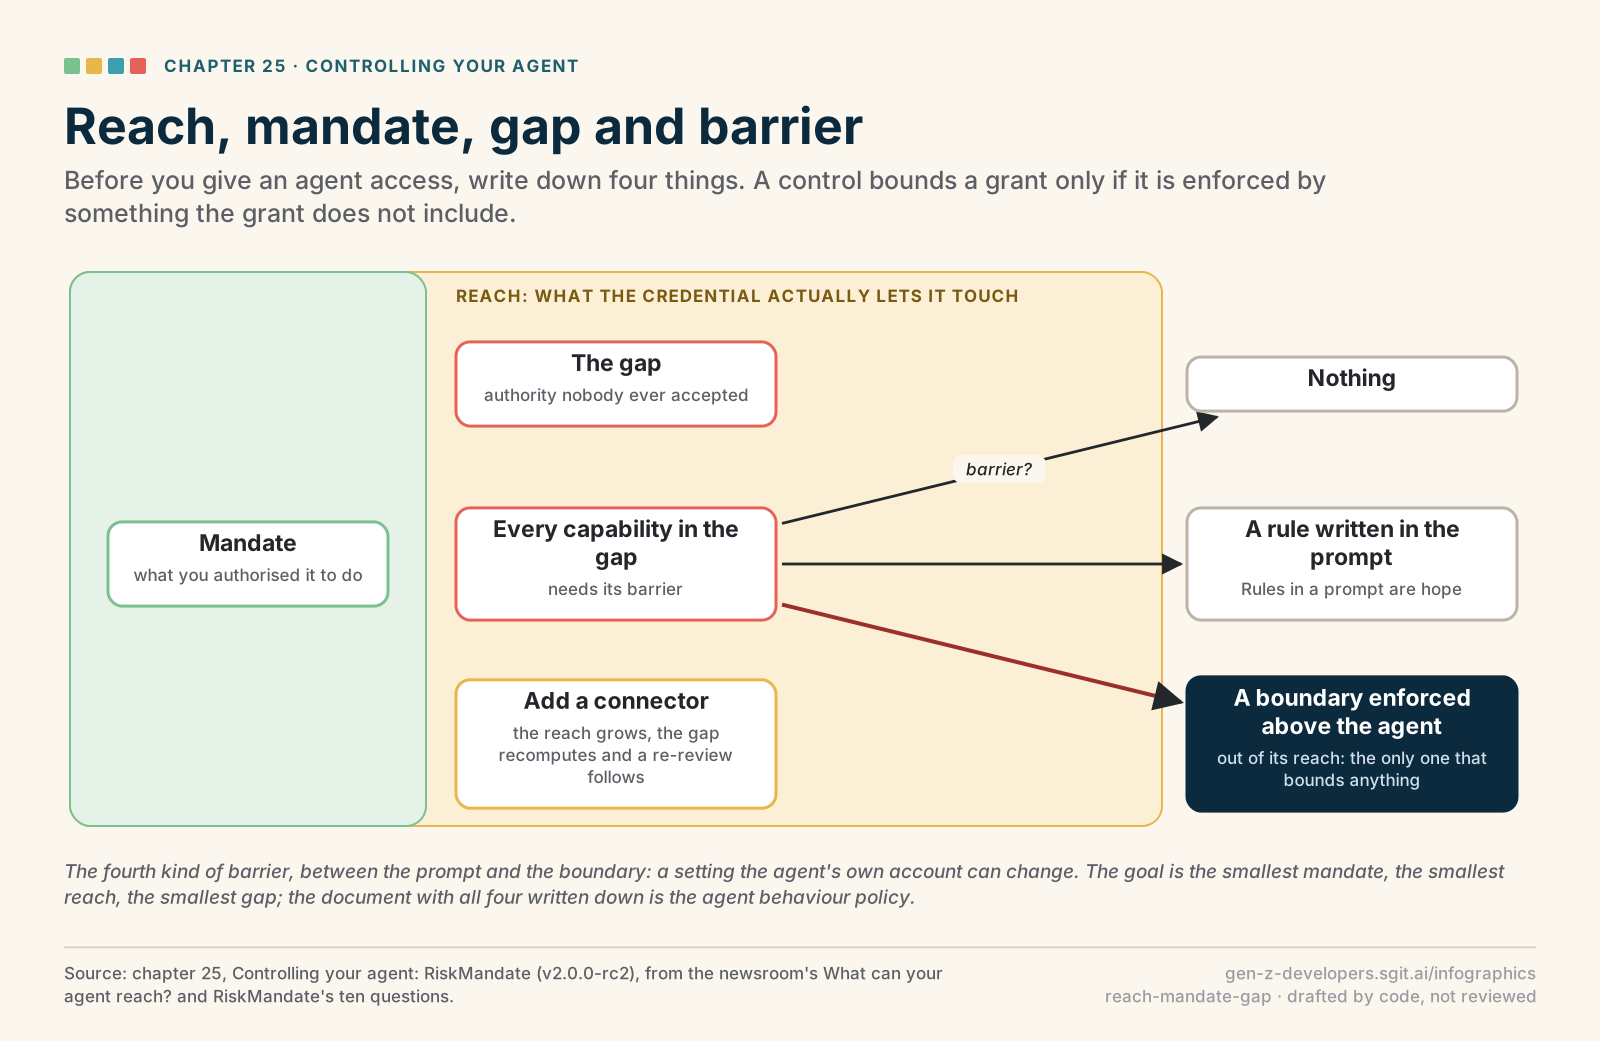 Reach, mandate, gap and barrier
Chapter 25 · Controlling your agent
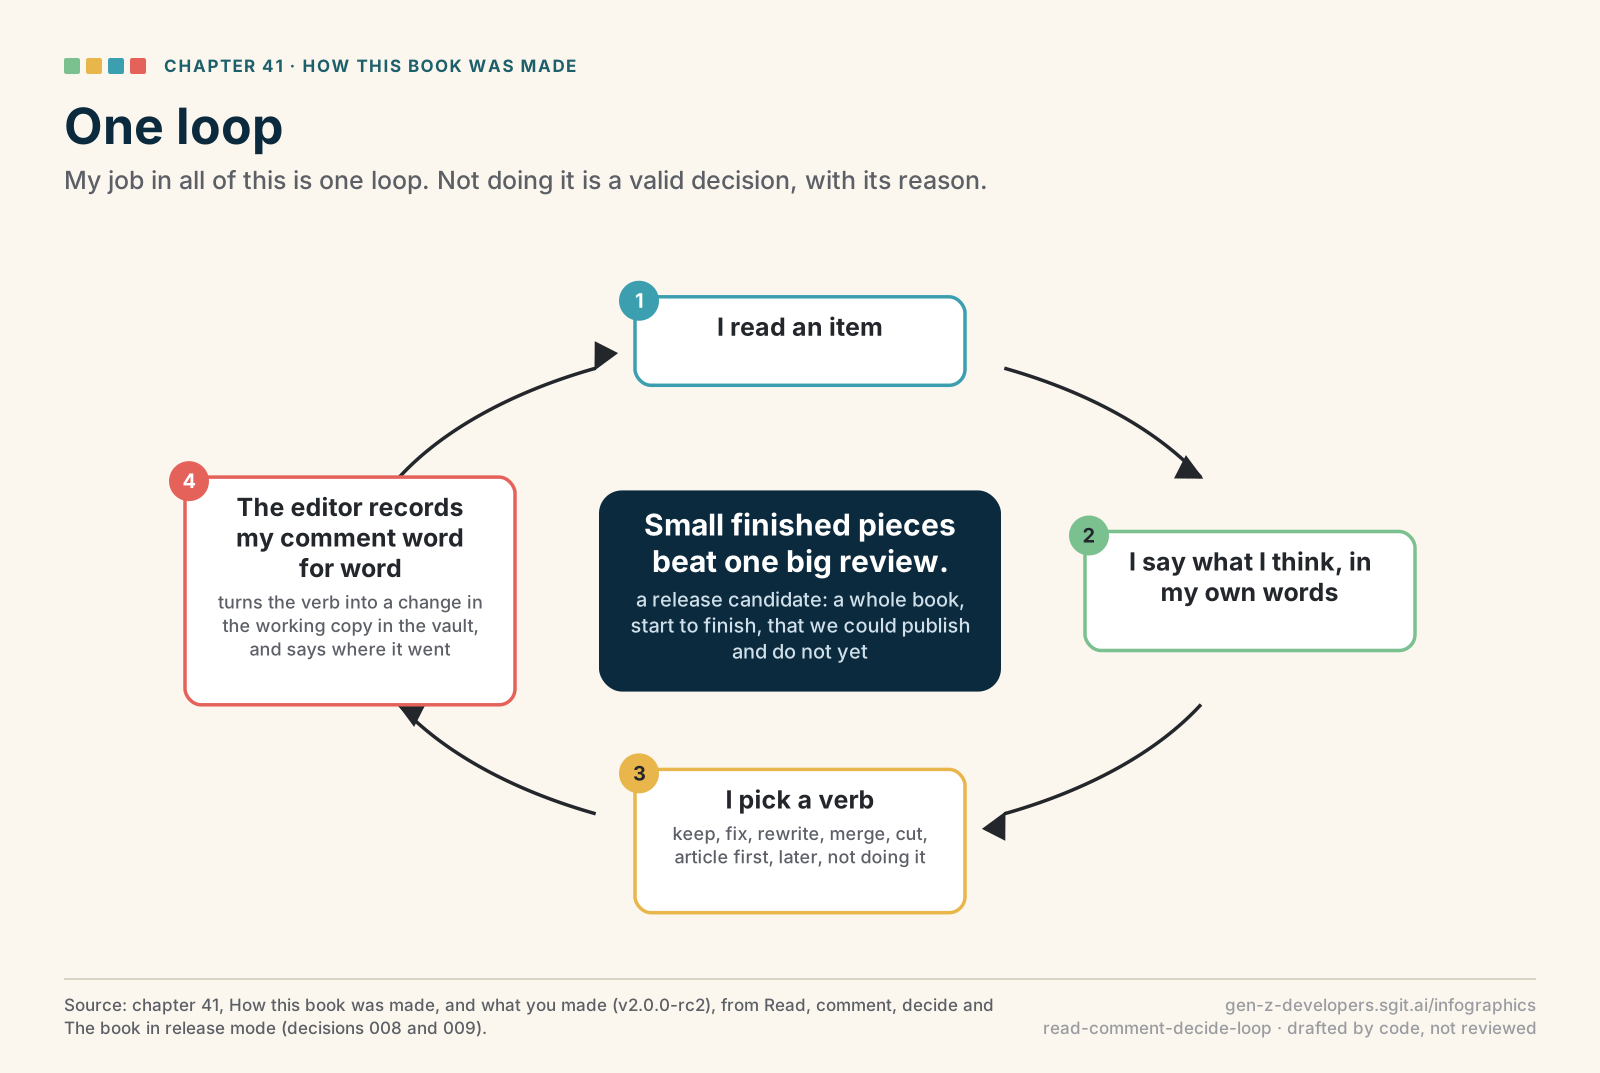 One loop
Chapter 41 · How this book was made
Written up in the agent article. Sources: admin/content/infographics/.