infographic · chapter · comparison · drafted
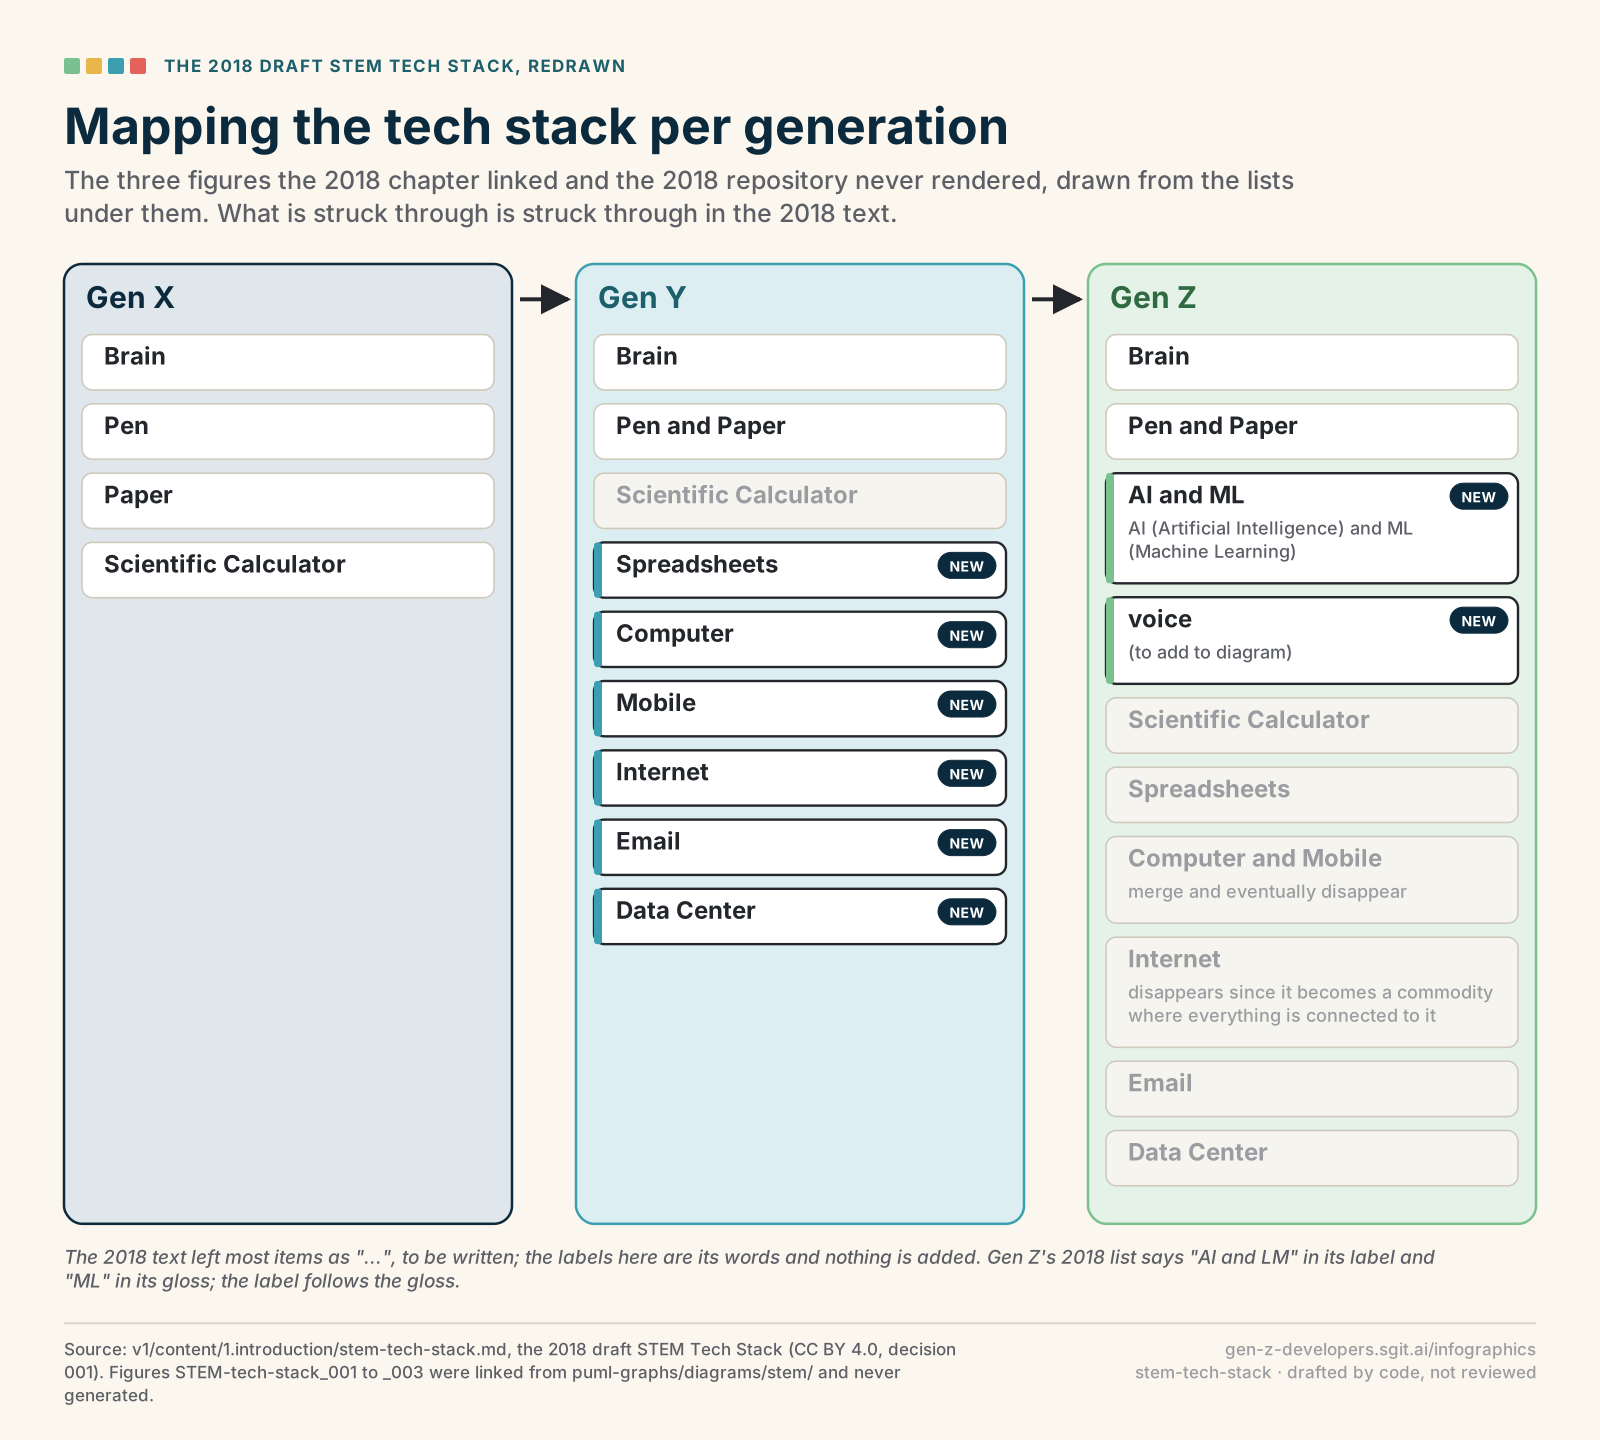
Mapping the tech stack per generation
For the 2018 file 1.introduction/stem-tech-stack.md · proposal stem-tech-stack in the plan
The SVG The data Review it in the plan
What it is for
The reviewer's open issue 003 asks whether to render the missing figures or redraw them as infographics; this is the redraw, from the 2018 text alone, ready for that decision. Chapter 8's tech-stack-per-generation proposal builds on it.
How it is made
Drawn by admin/build/infographic_svg.py from admin/content/infographics/drawn/stem-tech-stack.json, as a comparison. Change the data and rebuild; the picture follows. It keeps the book's colours in every theme of this site, because it is a printed picture: the same file goes into the PDF.
Notes
The 2018 text has 'AI and LM' in its label and 'ML' in its gloss; the drawing follows the gloss and says so. v1/ is frozen: the figure goes to the vault's working copy, or into chapter 8 through tech-stack-per-generation, never into v1/.
Checked against the source
Nothing on this drawing quotes the text; its numbers and labels come from the data named under it.